Help
Table of contents
General notes
Important Note: since this component is currently in development things may have changed since this tutorial was last updated. Furthermore, internal MPI-CBG users may have some additional options available.
Start Page
You will see an abstract of the paper on the start page. Above it, there is a big search box which can be made even bigger by dragging it by the thick lower border.
This seach box has some useful features:
- Autocomplete: type the first characters if a gene name or its alias and it will suggest you genes that begin with these letters.
- Multiple Search: search for as many genes as you want at once. They
- List support: Copy and paste your gene list straight from Excel or similar (one gene per line) to the searchbox and it will convert it so comma-separated
- Hot keys:
- "ctrl" + "arrow down": make search box bigger.
- "ctrl" + "arrow up": make search box smaller.
- "ctrl" + "enter": start search. (plain "enter" is used by the autocomplete function.)
Working with tables
Sorting, Filtering and changing column order
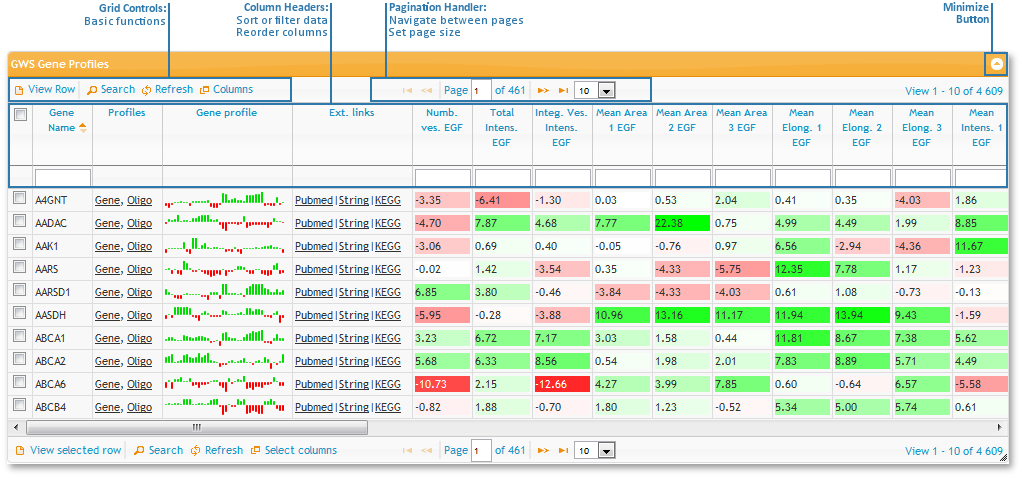
All tables used on this site have the same basic functionality:
- First of all, you can sort the tables by any column by left clicking on the column header. To change from ascending to descending, click the header again.
- To rearrange the order of the columns, drag and drop them by the column header.
- To filter rows by values, type in the boxes at the top of the columns, just below the column headers.
- If the column contains numeric values it will filter out everything below that value (equivalent to "greater than"-search).
- If the column contains characters it will filter values beginning with the typed letters (equivalent to "begins with"-search).
- Some tables have color coded values. That means that the background color depends on the value in each cell.
- values of -15 and below are deep red.
- values of +15 and above are deep green.
- values around zero are white.
- everything in between follows a linear gradation from respectively red to white or white to green.
Control bar buttons
There is a control bar at the top and at the bottom of each table.
The following buttons can eb found at the control button area at the left side:
-
View selected row: will open a popup window with all the information about the selected row.
- If several rows are selected, it will only open the detailed view of the first one.
- You can cycle through the rows with the arrows at the bottom of that window.
-
Search: will open a popup window where you can enter search criteria.
- You can use multiple criteria by clicking on the "+" symbol.
- Note that the search criteria are logically connected by the way specified in the bottom of the search window.
- Refresh: will reload the table and remove previous search criteria.
-
Select Columns: will open a popup window where you can select the columns that you want to see in the table.
- Hide columns by clicking on the "-" sign near the name of a column in the left box.
- Show columns by clicking on the "+" sign near the name of a column in the right box.
- Some columns are hidden by default and must be activated manually.
- Your selection will be saved in a cookie for future sessions.
Finally, there is a 'minimize table' button at the very left and some numbers, indicating which rows you are currently viewing and how many rows there are in this table, below it.
Links in data columns
Each row contains several links for the gene. The Profiles column links will lead you to either the profile of the specific gene or to all siRNA profiles of this gene. The links in the External links column will lead you to different websites with further information on that gene.
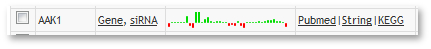
Additionally, there is a small preview of the gene profile in the column in between.
- This smaller profile can give you a brief overview of the data
- It has fixed values between -15 and +15, everything outside this values will be cut to +/- 15 to be consistent with the color code.
- It always shows all columns (visible and hidden), thus it may appear larger than the data set.
Compare Genes

- If you want to compare several profiles, simply select several rows (so that the checkboxes on the far left of the table are marked) and click on
 Show selected genes in below the table.
 - However, if you need to select genes which are on more than one page of the table you have to add them to a subset(
 Add to subset button) before changing the page of the table.
 - When you are done adding genes to your subset, click
 Show subset to get the gene profiles.
 - If you made a mistake you can clear the list by using the
 Clear subset button.
Resizing
You can also resize the table by dragging either the lower right corner or the lower or right sides of the table.
Working with charts
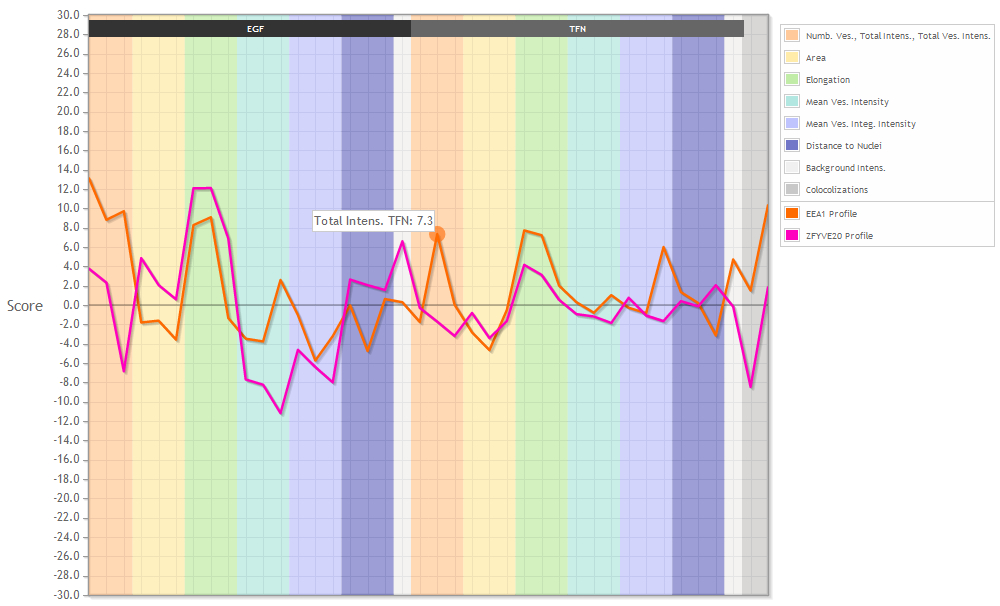
When viewing profiles you will see the graph above and a table with the respective data below. The legend on the right side tells you what the background colors mean and which graph is plotted in which color.
The plotted graphs can't be manipulated. You can see the name of the parameter and the specific value if you mouse over the graph.
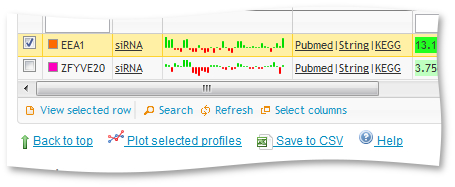
To view only a subset of the graphs simply select them in the table and click "plot selected profiles".
Export
Additionally there is the option to export the data as a .csv file (comma-separated, can be opened by most office programs like Microsoft Excel or LibreOffice Calc) for further use.
Viewing Images
As Java 1.7 have stronger security policy, to run ImageJA inside your browser, you have to change security level to Medium (Details)
When you open the siRNA or siRNA profiles of a specific gene, you will see some representative Images at the bottom of the page.
You can either click on the Thumbnail to view a larger version of the image as .jpg or view the image as a .tif directly in your browser using ImageJ, which is an Java Applet (and therefore requires Java to be installed).
The .tif files have a higher quality and they are split by colour channel. This gives you much more insight since you have far more control options.
If you use the ImageJ Applet there is one specific functionality which will be of great help:
Go to: Image -> Adjust -> Color Balance... . This will open an popup window which looks like this:
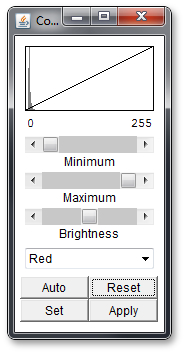
You can select the color channel (red, blue or green) in the dropdown menu below. If you select any of the other options like cyan, they will affect multiple color channels.
Once you have selected your color channel you can move the 3 sliders and look at the effect. Above the sliders you will see a representation of the slider positions in a mathematical way.
At this point it is helpful to play around with the sliders a bit and see what they do. If you mess up, use the reset button. Alternatively, use the Auto Button to let the program decide how to improve the settings, but note that if use the auto function to often on one channel the picture will get worse again.
The 'Set' button will allow you to fiddle around with some parameters of the sliders and the 'Apply' button will apply the settings to the picture so that you can edit a different color channel.
If you want to learn more about ImageJ, visit their documentation pages at:http://rsbweb.nih.gov/ij/docs/index.html